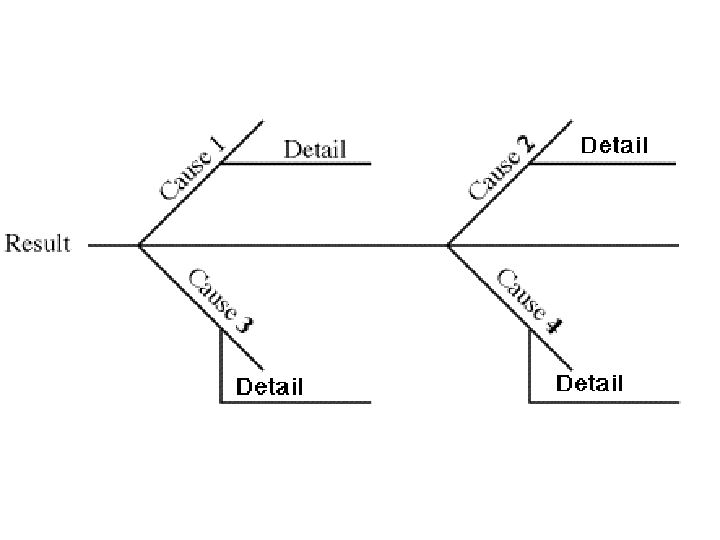
A Fishbone Map is used to show the causal interaction of a complex event (an election, a nuclear explosion) or complex phenomenon (juvenile delinquency, learning disabilities).
Key frame questions: What are the factors that cause X ? How do they interrelate? Are the factors that cause X the same as those that cause X to persist?

(Original page by Mary Frangie)
